*Snippets from Vicky's musings on [using FigJam for strategy, not just design](https://vickygu.com/figjam-for-strategy):*
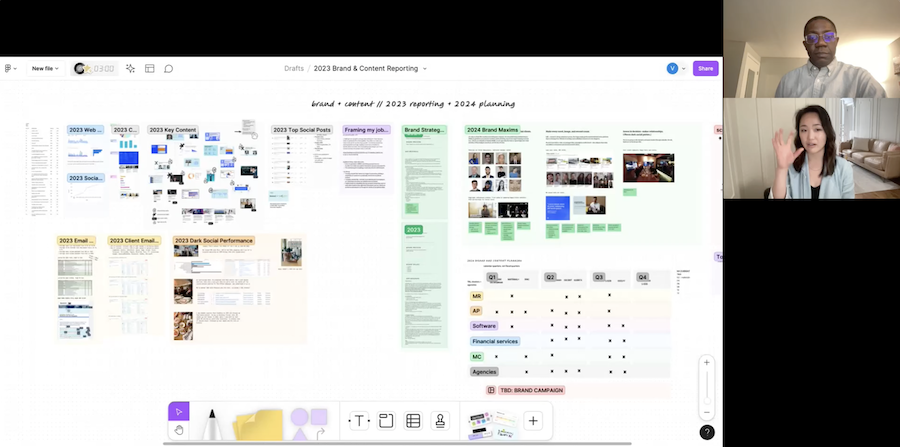
I'm going to now move to another example that is interesting in that it's a little more exploratory. And this goes back to this is me **testing out a hypothesis of - what does it look like to put data on an easel instead of just a spreadsheet?** So this is actually me when I was doing some end of year reporting last year and planning for the new year, and I realized I was pulling from so many disparate data sources like Google Analytics or Salesforce, HubSpot, LinkedIn, and I found it really helpful to have the information, the executive summaries of all that dropped in one space so I could start to make connections between those. To find trends in the data and the stories in the data, layered on with anecdotes, with stories of customer successes, especially even layering pictures. **You need to remember how you made a customer *feel* at moments too.**
And those are kind of the moments that help you understand, okay, how do we double down on those aspects? And yeah, ultimately use that to start to frame out, okay, what are our brand maxims? What are our pillars for the upcoming year? And this really, it made it a lot quicker to align on priorities and just directionally what we're thinking with our CMO.
---
On my side, it's interesting because we're also exploring it from a go-to-market perspective of - **how can tools like this, or tools using AI, be a thought partner to strategic work, whether it's independent or collaborative?** How does it make us better at go-to market strategy? I think especially on the business side, these disciplines are very strong in operational thinking, very strong in the language and the formats of spreadsheets and data.
And I will say this again, my hypothesis I'm trying to push forward is - what happens when we put data on easel instead of just a spreadsheet? Or how do they complement each other, right? Because the reality is strategic thinking is non-linear. It pulls from multiple inputs that are both qualitative and quantitative, and what does it mean when we are able to marry that sort of the messy thinking with the hard data, and have it all in one place?
And I think in the process, the underlying note is also like, **oh, is this culture change too?** Or is this not necessarily change, but does this help cultivate more interesting, more creative subcultures even within a business discipline? Or how does it make us just more diverse and rich in how we think and work and operate with each other?